This article provides a comprehensive comparison of housing costs in London and the Home Counties commuter belt in 2026, synthesising official data, price indices, and market trends to reveal where value lies for buyers and investors. It assesses average property prices, regional price growth, prime vs mainstream segments, and buyer affordability across Greater London, Surrey, Hertfordshire, Essex, Kent, and neighbouring counties. Using the UK House Price Index (UK HPI) and recent prime market analysis, we outline how commuter belt housing costs have evolved relative to London’s market, highlight key factors shaping pricing dynamics, and offer practical insights for prospective homebuyers and property investors, The WP Times reports.
Overview of the 2025–2026 UK Property Market
The English housing market has experienced a mixture of price growth and regional variation over the past year. According to the UK House Price Index (UK HPI) 2025, the average property price across England was approximately £296,000, with an annual increase of 6.7%. London continues to dominate the top end of the market with significantly higher prices compared to national averages.
Several factors are influencing these dynamics: limited supply in London, increased buyer interest in commuter towns, and broader macroeconomic trends, including mortgage rates and inflation. South East England and the East of England have seen higher-than-average growth due to strong demand from buyers seeking proximity to London but at relatively more affordable prices.
Key regional observations include:
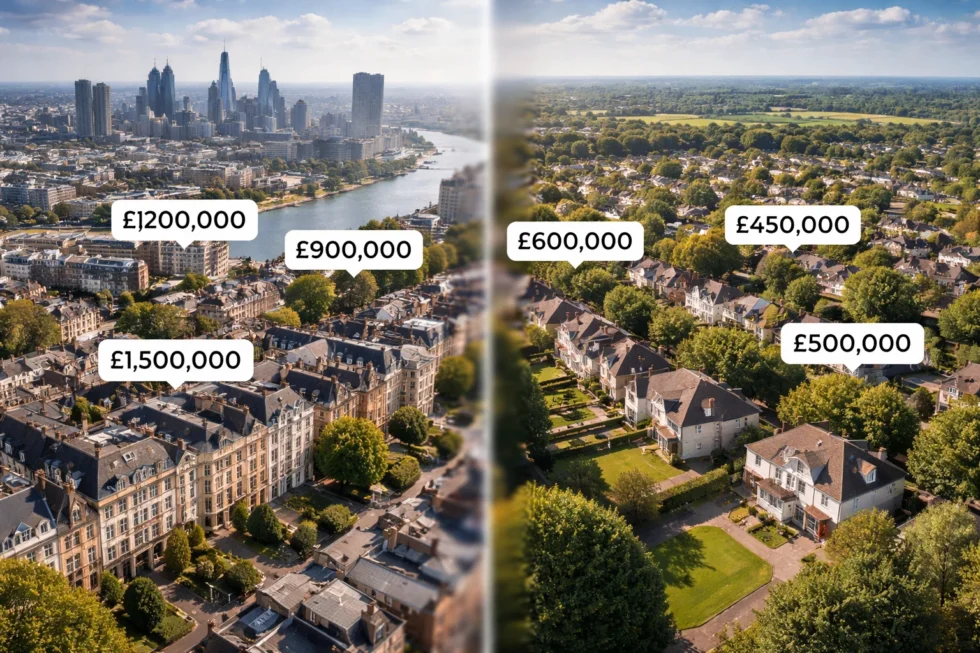
- Inner London boroughs remain at the highest price tiers, often exceeding £1 million for prime properties.
- Outer London boroughs offer slightly more affordable options, typically ranging from £400,000–£600,000.
- Commuter belt towns in the Home Counties display moderate prices but attract buyers seeking more space, gardens, and good schools.
Table: Average House Price by Region (2025)
| Region | Average Price | Notes |
|---|---|---|
| Inner London | ~£800k–£1.2m | Prime boroughs high end |
| Outer London | ~£400k–£600k | More accessible for families |
| Home Counties | ~£500k–£900k | Variation by county |
| National Average (England) | ~£296k | Reference benchmark |
London Average House Prices
London’s property market is highly stratified. Prime central boroughs like Kensington & Chelsea and Westminster command exceptionally high prices, reflecting both scarcity and demand for prestige addresses. Outer London boroughs such as Bromley and Bexley offer more reasonable options but remain above the national average.
Key trends:
- Price per square foot is highest in central boroughs, often double or triple that of outer boroughs.
- Property demand remains strong for homes near transport hubs, schools, and commercial centres.
- There is a two-tier market: prime and mainstream, with different growth trajectories and investment appeal.
Table: London Borough Prices (2025)
| Borough | Average Price | Notes |
|---|---|---|
| Kensington & Chelsea | £1,188,000 | Prime central |
| Westminster | £904,000 | Prime central |
| Camden | £876,000 | Prime central |
| Barnet | £586,000 | Outer borough |
| Bromley | £539,000 | Outer borough |
| Bexley | £403,000 | Outer borough |
Home Counties Commuter Belt: Price Overview
The Home Counties surrounding London, including Surrey, Hertfordshire, Essex, Kent, Buckinghamshire, Berkshire, and Sussex, provide a mix of premium and mid-range property options. Buyers are drawn to these areas for space, schooling, and relative affordability compared to London.
Observations from 2025–2026 market trends:
- Surrey remains the most expensive, with prime homes exceeding £1.4 million.
- Hertfordshire and Buckinghamshire feature strong commuter links, attracting families and professionals.
- Kent and Essex offer more affordable alternatives, typically in the £500k–£900k range.
- Overall, Home Counties pricing is highly variable depending on proximity to London, transport links, and property type.

Table: Sample Home Counties Median Prices (2025–2026 forecast)
| County | Typical Price Range | Prime Segment Notes |
|---|---|---|
| Surrey | £500k–£1.4m | High-end commuter towns |
| Hertfordshire | £600k–£1.0m | Strong demand near stations |
| Essex | £500k–£900k | Mixed affordability |
| Kent | £500k–£800k | Outer commuter belt |
| Buckinghamshire | £700k–£1.0m | Affluent suburbs |
Comparative Analysis: London vs Home Counties
Comparing London to Home Counties commuter towns highlights several patterns:
- Price disparity: Central London remains the most expensive, but prime Home Counties suburbs can rival outer London boroughs.
- Space advantage: Buyers often gain significantly more living space and gardens in commuter towns.
- Transport influence: Proximity to rail and tube stations is a key price driver in both London and commuter belt markets.
- Market segmentation: Both regions feature clear segmentation between prime properties and more affordable mainstream housing.
Table: Comparative Metrics (2025–2026)
| Metric | London | Home Counties | Notes |
|---|---|---|---|
| Typical prime average | £900k+ | £800k–£1.4m | Prime areas in Surrey highest |
| Value per sq ft | Highest UK | Lower than London prime | Relative affordability advantage |
| Forecast growth 2026 | ~4% | 3.5–4% | Market-dependent |
| Affordability | Lower for first-time buyers | Better than London core | Larger homes possible |
Factors Influencing Price Differences
Commuting and Transport
- High demand areas are closely linked to transport nodes.
- London prices increase near Underground, bus hubs, and mainline stations.
- Home Counties commuter towns experience premium pricing near stations that allow <1h commute to central London.
Supply and Demand
- London’s limited land constrains new supply.
- Home Counties offer larger plots and diverse housing types, including detached homes.
- Supply limitations in prime areas continue to push prices upward.
Affordability and Buyer Priorities
- Affordability pressures push families to commuter towns.
- Buyers prioritize schools, local amenities, and commuting convenience.
- Price growth is moderated by mortgage rates and broader economic conditions.
List of Key Influences on Price:
- Transport connectivity
- Local schools and amenities
- Property size and type
- Supply restrictions
- Interest rates and mortgage availability
Regional Price Growth Patterns in 2025–2026
Housing price growth has been uneven across England and within London and the Home Counties, with some regions outpacing others significantly. The UK House Price Index (UK HPI) shows that, between June 2024 and June 2025, London had one of the lowest annual price increases (0.8%) compared with other regions in England. Buyers in London generally saw slower price growth, while many other parts of England experienced stronger increases. This suggests that price momentum outside central London remains comparatively stronger, especially in commuter belt towns and more affordable regions.
Home Counties market dynamics are shaped by price growth that historically has outpaced the England average over decades, reflecting strong long‑term demand in commuter areas. Between 1999 and 2024, house prices in key Home Counties such as Essex, Kent, and Hertfordshire rose at significantly higher rates — often exceeding 350% growth since 1999, compared with around 295% in Surrey. This reinforces the pattern that demand for space, rail access to London, and lifestyle factors has durable pricing impact in the commuter belt.
Long‑term House Price Growth (1999–2024)
| County | Approx. Average Growth (%) | Notes |
|---|---|---|
| Essex | ~371% | Strong long‑term increase |
| Kent | ~364% | Lower starting base |
| Hertfordshire | ~336% | Close commuter proximity |
| Surrey | ~295% | Highest prices among counties |
| London (general) | ~varied | Strong peak values but slower growth recently |
This long‑term data indicates that while London remains expensive overall, commuter belts show sustained growth trajectories, particularly where transport links to London are strongest.
Impact of Mortgage Rates and Affordability
Mortgage conditions and access to credit are central to housing affordability in both London and the Home Counties. In late 2025 and early 2026, mortgage rates fell below 4–5% on many fixed‑rate products, improving affordability for buyers and enabling larger borrowing amounts under more lenient stress testing. This has translated into more homes being cheaper to buy than rent in some parts of the UK, a dynamic that can improve buyer confidence and stimulate demand — especially outside London where purchase prices are relatively lower.
Despite lower mortgage costs, affordability remains a challenge in London. This is reflected in the fact that average mortgage sizes reached record highs, with first‑time buyers borrowing around £210,800 on average, reflecting both higher local prices and relaxed affordability checks that allow buyers to borrow more. This trend is particularly marked in London relative to other regions due to higher average property values and living costs.
List: Mortgage and Affordability Factors (2025‑2026)
- Lower fixed mortgage rates (below 4–5%) improving buying conditions.
- Larger average first‑time buyer mortgages reflecting higher income and relaxed tests.
- Rent vs buy balance shifting as some homes cost less to purchase than rent.
- Affordability pressures strongest in London due to high property values.
Market Segmentation: Flats vs Houses
There remains a clear segmentation between property types across London and the Home Counties that affects price levels and buyer demand. Data from house price indices shows that semi‑detached homes in England experienced some of the strongest growth (+4.9% by mid‑2025), while flats and maisonettes showed weaker growth and in some cases a slight decline in value. This reflects both buyer preference and broader lifestyle shifts post‑pandemic: buyers seeking more space, particularly in commuter settlements, often prioritise houses over flats.
This segmentation effect is amplified in London where flats constitute a large share of housing stock, particularly in inner city areas. Prices for flats have been more volatile and subject to weaker demand relative to houses, partly because remote work trends and changing household preferences reduce the appeal of compact urban apartment living compared with suburban homes.
Table: Recent Price Change by Property Type (England)
| Property Type | Annual Change (%) | General Trend |
|---|---|---|
| Semi‑detached houses | +4.9 | Stronger growth |
| Flats/Maisonettes | -0.9 | Decline or stagnation |
| Detached houses | ≈ moderate | Consistent demand |
London Price Divergence Within Boroughs
London does not behave as a single homogeneous market; instead, there is a divergence of price dynamics within individual boroughs that has implications for buyers and investors. Official data shows that in mid‑2025 some boroughs experienced price increases while others saw declines. More affordable areas such as Barking & Dagenham and Bromley showed double‑digit annual increases, pointing to robust local demand where prices are lower. In contrast, boroughs such as Westminster and City of London saw price contractions, especially in prime segments.
This divergence highlights the importance of micro‑market analysis for any buyer comparing London vs Home Counties. Outer edges of London with lower baseline prices are increasingly attractive relative to prime central areas where price growth is constrained or negative.
Emerging Tax and Policy Influences on Market Value
Government policy continues to shape long‑term property market expectations. A recently discussed “mansion tax” proposal in the UK would introduce a council tax surcharge on homes valued over £2 million, potentially lowering effective values of such properties by at least 2.5%. Although this policy is scheduled to start after 2026, its announcement influences buyer and seller sentiment in London prime markets, where multimillion‑pound homes are concentrated. Experts note that such levies can affect sales volumes and deter transactions in high‑value pockets, thereby adding downward pressure on prices relative to other regions.
Other tax discussions include potential changes to stamp duty and targeted levies on property investors, which can impact investor yields and long‑term valuation models across both London and commuter belt markets.

Buyer Behaviour and Market Sentiment
Market sentiment provides context for pricing trends beyond pure numerical data. Surveys by the Royal Institution of Chartered Surveyors (RICS) indicated that as of late 2025, the UK housing market remained subdued with lower buyer enquiries and sales. While short‑term sentiment was weak due to fiscal policies and high borrowing costs, a cautious recovery was expected in early 2026 supported by potential interest rate cuts, particularly in more affordable regions including parts of the Home Counties.
Sentiment shifts can be especially important in commuter belt markets where buyer confidence influences listing volumes and negotiation dynamics. Higher listing volumes can increase buyer choice and negotiating power, potentially flattening prices in competitive areas — a trend observed in parts of the Home Counties prime market.
Supply Chain Factors and New Construction
Housing supply dynamics, including the rate of new construction and delivery of new homes, affect price levels and availability in both London and the Home Counties. Constrained land availability in central London limits new supply, which supports price stability or slow growth even when demand fluctuates. Conversely, commuter belt regions often have more space for new developments, leading to a wider variety of housing stock including larger family homes, detached houses, and new suburban developments.
However, recent delivery rates for new builds across the UK have lagged behind planning targets, which supports price resilience in supply‑constrained zones. Developers in commuter counties face planning and environmental constraints that can slow delivery, particularly near green belt areas. This dynamic strengthens long‑term valuation support in these regions, as supply remains insufficient to meet underlying demand.
Practical Advice for Buyers in 2026
For London buyers:
- Consider outer boroughs for better value.
- Evaluate commuting time versus cost.
- Determine whether prime or mainstream property fits investment goals.
For Home Counties buyers:
- Assess transport links to London.
- Evaluate schools, local amenities, and property condition.
- Consider negotiation leverage in high-listing counties.
Table: Buyer Considerations
| Factor | London | Home Counties |
|---|---|---|
| Transport | Underground, bus, rail | Mainline rail, park & ride |
| Space | Limited, smaller homes | Larger plots, gardens |
| Affordability | Low for first-time buyers | Better options outside prime zones |
| Schools | Varies by borough | Strong catchments in affluent areas |
London remains one of the most expensive housing markets in the UK in 2026, particularly in prime central boroughs. The Home Counties commuter belt provides more affordable options with larger homes and family-friendly amenities. Buyers need to balance pricing, commuting, schools, and property type when choosing between London and surrounding counties. Market trends suggest modest growth in London and strong demand for prime commuter towns.
Read about the life of Westminster and Pimlico district, London and the world. 24/7 news with fresh and useful updates on culture, business, technology and city life: Why London Tube and Bus Fares Rose in 2026 and How to Save