
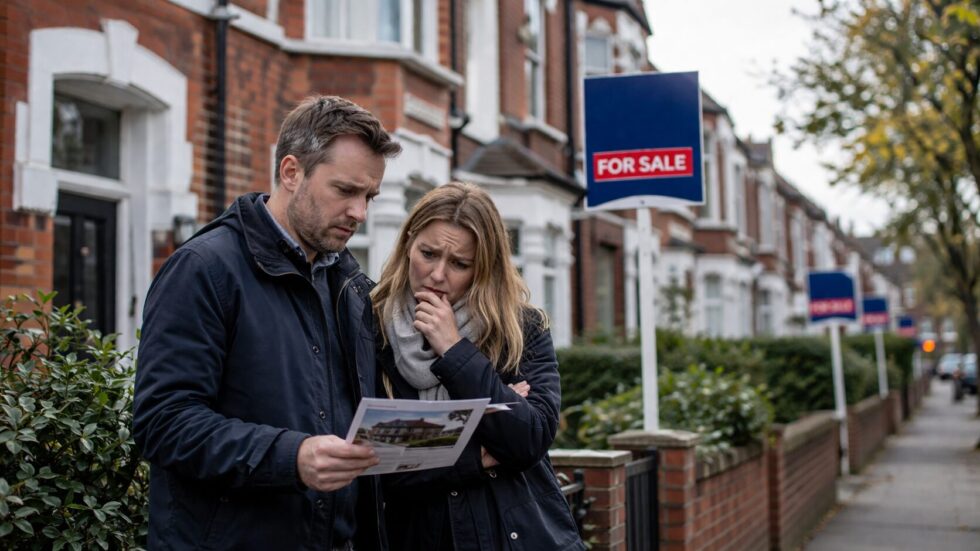
UK mortgage affordability has deteriorated to its weakest level since 2008, with homebuyers now typically spending 21.3% of their gross income on initial mortgage repayments, according to new UK Finance data. The pressure is most severe in parts of East Anglia and the London commuter belt, where buyers in several areas are committing more than a quarter of income to mortgage costs, The WP Times reports.
The figures cover 2025 and therefore do not yet capture the later economic shock linked to the Iran war, which pushed up borrowing costs and led to the withdrawal or repricing of many fixed-rate mortgage deals. That means the latest affordability picture may already understate the pressure facing buyers in 2026, even though fixed-rate pricing has shown some signs of easing in recent weeks.
UK Finance said the national headline figure hides sharp local differences, with affordability shaped by house prices, wages, buyer demographics and regional debt levels.
Where are UK mortgages least affordable
The least affordable local authority in the UK was North Norfolk, where initial mortgage repayments accounted for 25.7% of gross income. Hillingdon, in west London, followed at 25.1%, underlining how affordability pressure is not limited to inner London but extends into commuter areas.
Luton, Slough, Spelthorne, Havering, Harrow, Broxbourne, Barking and Dagenham, and Harlow also appeared among the least affordable places. Most of these areas sit within the broad orbit of London’s jobs market, where buyers often face high prices without always having central London incomes.
UK Finance’s measure looks at initial mortgage payments as a share of gross income, making it a practical snapshot of the monthly burden faced at the point of purchase.
| Least affordable area | Mortgage payments as share of gross income |
|---|---|
| North Norfolk | 25.7% |
| Hillingdon | 25.1% |
| Luton | 24.9% |
| Slough | 24.8% |
| Spelthorne | 24.8% |
| Havering | 24.6% |
| Harrow | 24.5% |
| Broxbourne | 24.4% |
| Barking and Dagenham | 24.3% |
| Harlow | 24.2% |
Why does the London commuter belt dominate the pressure map
The data points to a familiar housing-market problem: people move out of central London in search of more space or lower prices, but demand then pushes up values in towns connected to the capital. Areas such as Luton, Slough, Broxbourne and Harlow are often treated as more affordable alternatives to London, yet the mortgage burden shows that the gap can be much narrower once income is taken into account. Hillingdon is especially exposed because it combines London-level pricing with a mix of local and commuter demand.
North Norfolk’s position at the top of the list shows that affordability pressure is not only a London story, as lifestyle demand and local income levels can also distort the market. The result is a geography of strain where “cheaper than London” does not necessarily mean affordable.
Key reasons behind the pressure include:
- High house prices relative to local earnings.
- Commuter demand from buyers priced out of inner London.
- Higher mortgage rates compared with the ultra-low-rate years.
- Difficulty saving larger deposits.
- Regional differences in wages and buyer profiles.
Which UK areas are most affordable for homebuyers
At the other end of the scale, Scotland dominated the affordability ranking, with seven of the ten most affordable areas located there. East Ayrshire and Inverclyde were the most affordable, with buyers typically spending 17.0% of gross income on initial mortgage repayments. North Ayrshire, West Dunbartonshire, Eilean Siar, South Ayrshire and Dumfries and Galloway also featured among the more affordable locations.
The City of London appeared as the third most affordable area on this measure, an unusual result that UK Finance attributed to its very high-earning buyer profile and limited residential stock.
In other words, the ranking does not mean the City is cheap; it means those who buy there tend to have incomes high enough to absorb very expensive property.
| Most affordable area | Mortgage payments as share of gross income |
|---|---|
| East Ayrshire | 17.0% |
| Inverclyde | 17.0% |
| City of London | 17.1% |
| North Ayrshire | 17.2% |
| West Dunbartonshire | 17.7% |
| Eilean Siar | 18.0% |
| Mid Ulster | 18.2% |
| Causeway Coast and Glens | 18.2% |
| South Ayrshire | 18.2% |
| Dumfries and Galloway | 18.3% |
What did UK Finance say about the housing market
James Tatch, head of analytics at UK Finance, said recent years had been challenging for people trying to buy a property because affordability pressures were weighing heavily.
He added that the pain was not felt equally across the country, because property prices, wages and demographics vary sharply between and within regions.
That variation, he said, affects both homebuyer affordability and landlord returns. UK Finance also said 2025 was still a year of strong house-purchase borrowing, despite the affordability squeeze. Lenders advanced 723,000 mortgages for home purchase in 2025, a 17% increase from 2024.
The main figures are:
- 723,000 house-purchase mortgages advanced in 2025.
- 17% year-on-year increase in home-purchase mortgage lending.
- 21.3% of gross income spent on initial repayments on average.
- Highest national affordability burden since 2008.
- London borrowers carried the highest average mortgage debt, at about £280,000.
What does this mean for buyers in 2026
The most important warning is that the 2025 data may already be behind the real market. The Guardian reported that the figures do not reflect the economic turmoil linked to the Iran war, which contributed to higher mortgage costs and left many borrowers facing hundreds or even thousands of pounds more than before the conflict. Borrowers have recently seen some fixed-rate mortgage pricing ease, but the market remains highly sensitive to inflation, bond yields and Bank of England expectations.
Reuters reported that UK mortgage approvals rose to a four-month high in March 2026, showing resilience, but analysts still warned that higher rates could slow house-price growth later in the year.
For buyers, affordability is now less about the headline property price and more about the monthly repayment, deposit size and income test imposed by lenders.
For anyone planning to buy, the data points to several practical checks:
- Compare monthly repayments, not only asking prices.
- Test affordability against higher rates, not only today’s best deal.
- Check local income-to-repayment pressure before choosing a commuter town.
- Consider whether a cheaper area still carries high transport costs.
- Avoid assuming that “outside London” automatically means affordable.
Read about the life of Westminster and Pimlico district, London and the world. 24/7 news with fresh and useful updates on culture, business, technology and city life: UK inheritance tax on pensions: why the wealthy are raiding savings before 2027