For a decade the Silvertown Tunnel was an argument before it was a road. It was argued over at planning inquiry, argued over in council chambers in Newham and Greenwich, argued over on placards outside City Hall, and argued over in the letters pages of every local paper east of Tower Bridge. Now, fifteen months after the first vehicles nosed through its 1.4km bore beneath the Thames, the arguing has moved onto firmer ground: numbers. Transport for London has published its 12-month monitoring report on the £2.2bn crossing, and the headline finding is that the thing works — congestion at the notoriously choked Blackwall Tunnel has fallen sharply, over-height vehicle incidents are down by nearly a quarter, buses are carrying a share of cross-river traffic that would have been unimaginable two years ago, and nitrogen dioxide concentrations in the surrounding area have dropped by 17%. Sir Sadiq Khan, who inherited the scheme and then defended it through years of political incoming, called it a success that was "not only cutting journey times but encouraging more sustainable transport", and said he was "particularly pleased to see major reductions in congestion at the Blackwall Tunnel benefitting businesses and local residents", The WP Times reports.
But the people who fought the tunnel have read the same report and drawn a diametrically opposite conclusion — and, awkwardly for TfL, they have a serious argument. The Stop the Silvertown Tunnel Coalition points out that fewer vehicles are crossing the Thames in east London now than before the tunnel opened, which is an odd result for a project sold on the basis of adding capacity. Their reading is that the improvement came not from the extra bore but from the toll of up to £4 per peak crossing that was slapped on the previously free Blackwall Tunnel on the same day Silvertown opened. Charge people to use a road and fewer people use it: that is not an engineering achievement, it is a price signal, and one that could have been applied to Blackwall alone for a fraction of £2.2bn. "The solution was always to toll the Blackwall Tunnel and invest the £100m per year proceeds in modernising London's public transport and active travel infrastructure," the coalition said, restating its view that the tunnel remains an "immense waste of public money". A spokesperson for the Greenwich Society, which opposed the scheme throughout, said the crossing had shifted traffic elsewhere rather than solving congestion, pushing drivers towards toll-free alternatives — the Woolwich Ferry, Tower Bridge, the Rotherhithe Tunnel. The coalition also cautioned that a single year is "too soon to assess the long-term impact". What follows is what the report actually says, question by question, and where the evidence genuinely supports each side.
What exactly is the Silvertown Tunnel
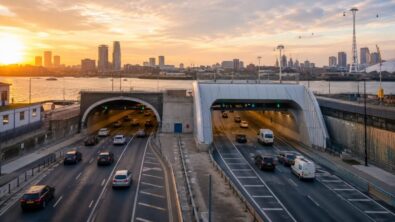
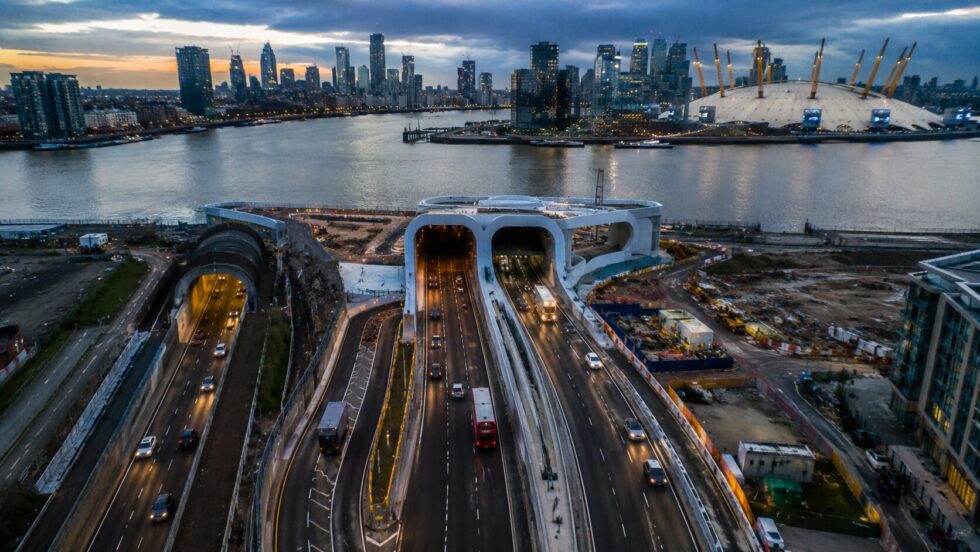
It is a 1.4km (0.9 mile) twin-bore road tunnel under the Thames in east London, linking the Silvertown area on the north bank with the Greenwich Peninsula on the south. It opened on 7 April 2025 and cost £2.2bn. It runs a short distance west of the Blackwall Tunnel, and the two crossings are designed to function as a pair rather than as competitors: Blackwall's northbound bore is Victorian in origin and notoriously restrictive, and the scheme's central premise was that a modern, high-clearance sister tunnel would take the pressure off it.
Unlike Blackwall, Silvertown was built with a dedicated lane for buses — and, controversially, HGVs — which is the mechanism behind the public transport figures discussed below.
What has it done to journey times
This is where TfL's case is strongest, and the numbers are not marginal. According to the 12-month monitoring report, journey times around the Blackwall Tunnel fell significantly. Northbound trips between Sun in the Sands and the tunnel were on average 58% quicker during the morning peak and 47% quicker in the evening peak, measured against 2024/25. The report also records that morning peak journeys on the route were 126% faster, and that southbound journeys between Bow Roundabout and the Blackwall Tunnel were 70% faster.
Weekday northbound traffic on the A12 — the great feeder artery that has spent decades backing up towards the Blackwall approach — fell by 2%.
For anyone who has sat in the Blackwall northbound queue at half past eight on a Tuesday, those are the figures that matter. A morning commute that halves in duration is not a rounding error.
What about the over-height vehicle problem
Blackwall's northbound bore has a low, curved profile that has caused an almost comic — and enormously expensive — recurring failure: lorries getting stuck. Before Silvertown opened, the Blackwall Tunnel saw around 700 closures a year, frequently caused by wedged HGVs, each one radiating delay across half of east London. Since the new tunnel opened, over-height vehicle incidents at Blackwall have fallen by 23%.
This is arguably the least contested benefit in the entire report. Silvertown was built to modern clearances; drivers of tall vehicles now have somewhere to go. No toll mechanism explains that improvement — it is a physical fact about the new bore.
What has happened to buses
The most striking single statistic in the report. More than 11% of all tunnel trips are now made by bus — a 290% increase on pre-opening levels. More than 10,000 journeys cross the Thames each day on routes 108, 129 and the SL4. Alex Williams, chief customer and strategy officer at TfL, said: "By making it easier to travel by bus across and near the river, we're also seeing a surge in customers choosing to travel more sustainably."
Context matters here. When the tunnel opened, TfL made bus journeys through the Silvertown and Blackwall tunnels free — a substantial inducement, and one that ran until 26 May 2026. The 290% figure therefore covers a period in which the alternative to driving was not merely cheaper but free at the point of use, while driving simultaneously became newly expensive. Whether the bus share holds now that fares have returned is the single most important open question for the second-year report, and the report does not answer it.
What about cycling
The free cycle shuttle service — provided because bicycles cannot use the tunnel itself — was used between 100 and 130 times each weekday between April and October 2025, with much lower demand over the winter months. That is a small number by any measure. It is a shuttle, not a crossing, and the seasonal collapse suggests it functions as a fair-weather convenience rather than a genuine active travel link.
What does it cost drivers
Drivers using both tunnels pay up to £4 per crossing during peak hours. TfL says the charge covers traffic management and the running costs of the crossings. The critical political fact is contained in that word "both". Blackwall was free before April 2025. The toll was not introduced to pay for Silvertown alone; it was applied across the pair, which is precisely what makes the campaigners' counterfactual so potent.
Is the tunnel paying for itself
Not yet, and not at the rate forecast. TfL previously said it expected to repay about £100m a year through toll revenue. The actual repayment for the last financial year was about £67m. That is a shortfall of roughly a third against expectation in year one. TfL has not, in this report, revised the long-run £100m figure — but a gap of that size in the opening year is the sort of number that tends to reappear in Assembly questioning.
Has air quality improved
Average nitrogen dioxide (NO₂) concentrations in the area fell by 17% compared with the year before the tunnel opened. TfL's own report attaches the necessary caveat: NO₂ in the area has been declining for the past five years anyway. London-wide vehicle fleet turnover, ULEZ effects and general emissions improvement all push in the same direction. The 17% cannot be cleanly attributed to the tunnel, and the report does not claim it can.
Has traffic increased overall — the induced demand question
No, and this is the finding both sides seize on. Traffic across both east London river crossings has remained below pre-tunnel levels, with no increase in weekday cross-river journeys despite Silvertown opening.
TfL presents this as vindication: the great fear of the objectors was that a new road would generate new traffic, and it has not. Opponents present the identical fact as indictment: if you build £2.2bn of new capacity and fewer vehicles cross the river than before, the capacity was not what was needed. The toll suppressed demand; the tunnel absorbed what was left.
Both readings are supported by the data. Which one you find persuasive depends largely on what you think the £2.2bn was for.
Where has the displaced traffic gone
Not everywhere improved. The report is candid about this. Journey times at the Rotherhithe Tunnel increased, with weekday traffic rising by 3%. TfL attributes this to problems in key operating systems rather than displacement.
Demand for the Woolwich Ferry stands above pre-Silvertown levels, with operations also affected by technical problems. The Greenwich Society reads these two lines as the whole story in miniature. A spokesperson said the tunnel charges had pushed drivers towards toll-free crossings — naming the Woolwich Ferry, Tower Bridge and the Rotherhithe Tunnel — and that the scheme had shifted traffic elsewhere rather than solving congestion.
TfL's technical-fault explanation and the displacement explanation are not mutually exclusive, and a year of data is not enough to separate them. This is one of the areas where the coalition's "too soon" objection has real force.
Who objected, and what did they want instead
Both Newham and Greenwich councils originally called for the tunnel to be repurposed exclusively for public transport — that is, built but closed to private cars. Campaigners separately questioned the plan to allow HGVs into the dedicated bus lane, on the grounds that it dilutes both the reliability benefit for buses and the environmental case.
The Stop the Silvertown Tunnel Coalition's alternative was simpler and cheaper: toll Blackwall, build nothing, spend the £100m a year on public transport and active travel. Their position after the first-year report is unchanged — the tunnel is an "immense waste of public money", and the traffic improvement is "mainly down to the new tolls discouraging people from driving, rather than the extra tunnel capacity."
What should a driver, bus user or resident take from this practically
If you drive north through Blackwall in the morning peak: your journey is, on average, materially faster than it was in 2024/25 — 58% faster on the Sun in the Sands approach — and you are now paying up to £4 for it where you previously paid nothing. Whether that is a good trade is a personal calculation, but the time saving is real and measured.
If you drive southbound from Bow: 70% faster on that stretch.
If you have been detouring to avoid HGV closures: the 23% drop in over-height incidents means the Blackwall shutdown lottery is meaningfully less likely to catch you.
If you use the 108, 129 or SL4: you are part of a 10,000-a-day cross-river bus flow that essentially did not exist in this form before. Note that free travel on tunnel bus routes ended on 26 May 2026 — check the fare before you assume.
If you use the Woolwich Ferry or Rotherhithe: expect it busier and less reliable than before. Rotherhithe weekday traffic is up 3%, ferry demand is above pre-tunnel levels, and both have had technical problems.
If you cycle: the shuttle exists, runs, and is lightly used — roughly 100–130 weekday uses in the warmer months, far fewer in winter.
What Are the Open Questions for Year Two
Four, on the report's own evidence — and each of them is the kind of question that decides whether the second-year monitoring report reads as a victory lap or a climbdown.
First, whether bus use holds. The 290% increase is the single most quotable figure TfL has produced, and it was earned under conditions that no longer exist. Free travel on tunnel bus routes ran from opening day until 26 May 2026; the monitoring period sits almost entirely inside that window. During it, driving became newly expensive at up to £4 a peak crossing while the bus became free — a gap of £4 in one direction, £8 on a return, every working day. That is roughly £40 a week for a five-day commuter, and it is a powerful reason to try the 108, the 129 or the SL4 at least once. The genuine question is how many of those 10,000 daily journeys were habit-forming and how many were price-shopping. TfL will know by autumn. The report does not, because it predates the answer.
Second, whether the money arrives. TfL forecast about £100m a year in toll revenue and booked about £67m in the last financial year — a shortfall of roughly a third in year one. There are innocent explanations: ramp-up, discount schemes, drivers still learning the charging structure, and the simple fact that a toll which successfully suppresses traffic necessarily suppresses its own revenue. But £2.2bn of borrowing does not care about innocent explanations. Either the figure climbs towards forecast, or the forecast is quietly revised, or the difference is found elsewhere in TfL's budget. All three outcomes are politically legible, and only one of them is comfortable.
Third, whether Rotherhithe and the Woolwich Ferry recover. TfL attributes rising Rotherhithe weekday traffic (up 3%) and above-baseline ferry demand to problems in key operating systems. The Greenwich Society attributes both to drivers routing around a £4 charge towards the toll-free crossings — the ferry, Tower Bridge, Rotherhithe. These explanations produce identical data in year one and completely different data in year two. If the technical faults are fixed and the pressure eases, TfL was right. If the faults are fixed and the traffic stays, it was displacement all along, and the coalition's central charge — that the scheme moved congestion rather than removing it — acquires evidence rather than merely argument.
Fourth, whether the air quality gain is actually the tunnel's. NO₂ concentrations fell 17% against the preceding year, but TfL's own report notes the decline has been running for five years regardless. Fleet turnover, ULEZ effects and Europe-wide emissions standards all push the same way. One year cannot separate the tunnel's contribution from the trend it sits inside. Two or three years of divergence — or convergence — will.
There is a fifth question the report cannot ask itself, and it is the one that will define the political argument: whether a year is long enough at all. The Stop the Silvertown Tunnel Coalition says it is "too soon to assess the long-term impact", and on the specific matter of induced demand they are on solid methodological ground. Traffic responds to new road capacity over years, not months, as land use, journey habits and commercial routing gradually adjust. A crossing that shows no traffic growth in year one may show it in year four. That is not a prediction — it is the reason transport economists insist on long monitoring windows, and the reason TfL committed to more than one report.
Questions and Answers for Drivers
Do I have to pay to use the Blackwall Tunnel now, or only Silvertown?
Both. This is the single most common misunderstanding about the scheme. The charge applies to both crossings, up to £4 per crossing at peak times. Blackwall was free before 7 April 2025; it is not free now, and choosing it over Silvertown does not avoid the charge.
What am I actually getting for that £4?
On the northbound Blackwall approach from Sun in the Sands, an average journey 58% quicker in the morning peak and 47% quicker in the evening peak than in 2024/25. Southbound from Bow Roundabout, 70% quicker. TfL also records morning peak journeys on the route running 126% faster. Those are averages over twelve months, not guarantees on any given Tuesday, but they are large enough that the time saved is real rather than statistical noise.
Is it worth paying, or should I go round?
Do the arithmetic on your own trip rather than on principle. A £4 peak crossing against a saving of twenty or thirty minutes on the Blackwall approach is straightforwardly good value for anyone whose time has a price — a trades van, a delivery round, a courier. For a leisure trip with no deadline, the free alternatives may still make sense. Just be aware that the free alternatives are where everyone else has gone: Rotherhithe weekday traffic is up 3%, the Woolwich Ferry is running above pre-tunnel demand, and both have had technical problems. The toll-free route is no longer the quiet route.
Which tunnel should I use if I'm in a tall vehicle?
Silvertown, and this is the clearest practical advantage the scheme has delivered. Blackwall's northbound bore has a low, curved Victorian profile that has caused an absurd volume of disruption — around 700 closures a year before Silvertown opened, frequently caused by wedged HGVs. Silvertown was built to modern clearances. Over-height incidents at Blackwall are down 23% since it opened, which is the one improvement in the entire report that no toll mechanism can explain.
Are the tunnels more reliable now, or just faster?
Both, and the reliability gain may matter more to working drivers than the speed gain. A 23% reduction in over-height incidents means the Blackwall shutdown lottery — the closure that turns a twenty-minute crossing into ninety and radiates delay across half of east London — is meaningfully less likely to catch you. Journey time averages are useful; not losing an hour unpredictably is what actually protects a schedule.
Can I take an HGV through the bus lane?
Silvertown was built with a dedicated lane for buses and HGVs. Campaigners objected to that design specifically, arguing that admitting lorries dilutes both the reliability benefit for buses and the environmental case for the scheme. That objection has not been resolved; it has simply been overtaken by the tunnel opening.
Has the new tunnel made traffic worse anywhere?
Yes, on the report's own figures. Journey times at the Rotherhithe Tunnel have increased and weekday traffic there is up 3%. Woolwich Ferry demand stands above pre-Silvertown levels. TfL attributes both to problems in key operating systems rather than to displaced drivers; the Greenwich Society attributes them to drivers avoiding the charge. Whichever is right, the practical advice for a driver is identical — do not assume the toll-free crossing is the fast crossing.
Will the toll go up?
The report does not say. What it does say is that first-year repayment came in at about £67m against an expectation of about £100m a year. A revenue gap of that size in year one is exactly the condition under which charging structures get reviewed — but no change has been announced, and speculating beyond the published figures would be guesswork.
Is there anything for cyclists?
A free shuttle service, since bicycles cannot use the tunnel itself. It ran between 100 and 130 times each weekday from April to October 2025, with much lower demand over winter. That is a modest number and a strongly seasonal one, which suggests it functions as a fair-weather convenience rather than a genuine year-round crossing.
If I switch to the bus, what does it cost me now?
Not nothing, which is the change. Free travel on the tunnel bus routes ended on 26 May 2026. The routes — 108, 129 and SL4 — carry more than 10,000 cross-river journeys a day and are the reason more than 11% of all tunnel trips are now made by bus. But the fare is back, so check it before assuming the sums that worked in 2025 still work now.
The report shows a crossing that has demonstrably improved journey times on the Blackwall approaches, cut lorry-strike closures by nearly a quarter, moved a real and substantial number of people onto buses, and coincided with cleaner air — while carrying fewer total vehicles across the river than before it existed, generating a third less revenue than forecast in its first year, and coinciding with worsening conditions at two toll-free alternatives. Every one of those clauses is drawn from the same document. That is what makes this scheme so unusually hard to argue about: there is no disputed dataset, no rival set of figures, no accusation of bad faith over the measurements. TfL and the campaigners are reading the same twelve months of monitoring and disagreeing about what caused it.
Sir Sadiq Khan calls it a success that is "not only cutting journey times but encouraging more sustainable transport", and says he is "particularly pleased to see major reductions in congestion at the Blackwall Tunnel benefitting businesses and local residents". Alex Williams of TfL points to the modal shift: "By making it easier to travel by bus across and near the river, we're also seeing a surge in customers choosing to travel more sustainably."
The Stop the Silvertown Tunnel Coalition calls it an "immense waste of public money" and restates the alternative it argued for throughout: "The solution was always to toll the Blackwall Tunnel and invest the £100m per year proceeds in modernising London's public transport and active travel infrastructure."
Both positions survive contact with the evidence. The tunnel did what a tunnel does — it added a modern, high-clearance bore that lorries can pass through, which is why over-height closures fell. The toll did what a toll does — it priced marginal trips off the road, which is why traffic fell and journey times improved. Disentangling the two is the work of the next monitoring report, and possibly the one after that. Until then, the crossing that spent a decade as an argument remains one. The difference is that the argument now has numbers attached, and both sides can quote them accurately.
Read about the life of Westminster and Pimlico district, London and the world. 24/7 news with fresh and useful updates on culture, business, technology and city life: How old is Madonna? Her age as she opens the 2026 World Cup halftime show
Materials used: BBC News, Transport for London 12-month monitoring report, PA Media, Getty Images, Stop the Silvertown Tunnel Coalition, The Greenwich Society, Newham Council, Greenwich Council, Mayor of London.