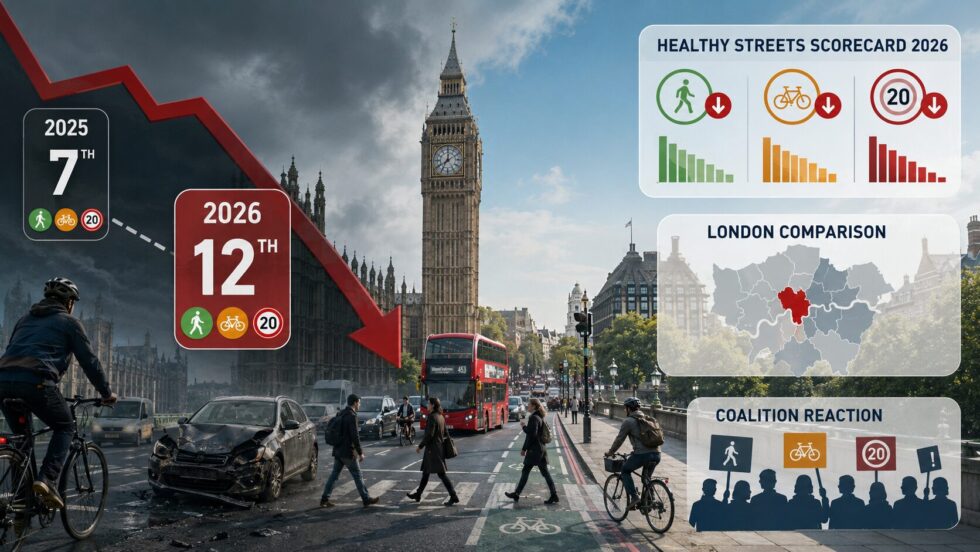
Westminster has fallen from 7th to 12th place in the annual London Boroughs Healthy Streets Scorecard, published on Monday 6 July 2026 by the Healthy Streets Scorecard Coalition — a group of health, environment and transport campaigners including CPRE London, London Living Streets, Possible, RoadPeace and Sustrans — after a year in which walking and cycling participation fell and pedestrian and cyclist casualty rates worsened in the borough, according to a press release and indicator reports sent to The WP Times ahead of the launch.
The Scorecard, published every July since 2019, ranks all 33 London boroughs on ten indicators reflecting the Mayor's Transport Strategy: six "input" measures councils deliver directly — Low Traffic Neighbourhoods (LTNs), 20mph limits, Controlled Parking Zones (CPZs), protected cycle track, school provision and bus priority — and four "outcome" measures covering how residents travel, casualty rates and car ownership. Westminster's overall score for 2026 is 5.69 out of 10, down from 5.89 in 2025.
Westminster's Results: Strong Foundations, Falling Momentum
The borough's underlying position remains one of the strongest in the capital, according to the coalition's data:
- Car-free living: more than three-quarters of Westminster households do not own a car — the highest proportion in the Scorecard. The report lists Westminster alongside the City of London, Kensington & Chelsea, Islington, Camden and Hackney as the six areas where over 70% of households are car-free.
- Sustainable travel: Westminster is named among the four boroughs leading Inner London on sustainable modeshare — the share of residents' trips made by walking, cycling or public transport — together with the City of London, Camden and Islington, against an Inner London average of 82.1%.
- Speed limits: complete 20mph coverage on borough-managed roads, maintained for another year. Westminster is one of nineteen boroughs where 95% or more of council-controlled roads carry a 20mph limit.
- Parking: near-complete Controlled Parking Zone coverage.
- Bus priority: a small addition over the past year, alongside Barnet, Islington and six other boroughs — though well behind Lewisham and Hackney, which each added more than 10km of prioritised route.
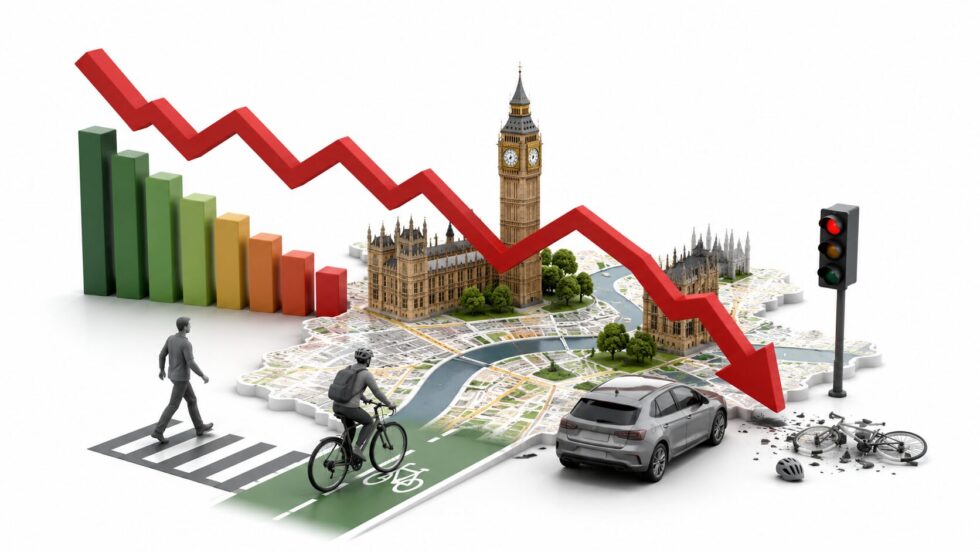
Several indicators, however, moved in the wrong direction, and these drove the five-place fall:
- Westminster now has the lowest LTN coverage in Inner London. Across the capital, new LTNs were delivered by Lambeth (four new zones), Hackney (the Hackney Central bus gate), Islington (the Mildmay scheme), Camden (new filters) and Hammersmith & Fulham (the Wormholt scheme), while Croydon's removal of six LTNs left London-wide coverage almost flat, edging from 22.1% to 22.2%.
- School Street coverage fell. The report notes a major methodology change this year: School Streets must now be enforced with cameras or physical barriers to be counted, as sign-only schemes "are not proving effective". London's total now stands at 829, covering nearly 30% of schools, with Lewisham leading on 66% coverage — but the coalition warns the pace of delivery must accelerate to reach the Mayor's target of 1,000 School Streets by 2030.
- Walking and cycling participation both fell in the borough, against a mixed London picture in which recent increases in Islington, Richmond, Lambeth and elsewhere are attributed by the report to infrastructure improvements and the expansion of dockless cycle hire.
- Pedestrian and cyclist casualty rates worsened. London-wide, the report estimates 95 road fatalities in 2025 — the joint-lowest figure outside the pandemic year — but states the capital remains behind its Vision Zero target. Across London, there were 5.8 serious and fatal pedestrian casualties per 100,000 daily walking stages, and 1.9 cyclist casualties per 1,000 daily cycling stages.
"Evidence shows most people want safer, quieter, less-polluted streets," a coalition spokesperson said. "While some residents are reaping the benefits of action, it's not good news everywhere. In Inner London, Lewisham and Kensington & Chelsea are scoring lower than others, and Westminster has dropped behind the leaders."
How London Performed Across the Ten Indicators
This year's winners are Islington, Waltham Forest and the City of London, with Waltham Forest named star improver after climbing four places. Alice Roberts, chair of the Healthy Streets Scorecard Coalition, presented the Best Inner London Borough certificate to Cllr Rowena Champion, Islington's Executive Member for Climate, Environment and Transport.
| Indicator | 2026 headline | Leaders | Westminster |
|---|---|---|---|
| LTNs | London coverage 22.2% (up 0.1pt) | Lambeth, Hackney, Islington, Camden, H&F added schemes | Lowest coverage in Inner London |
| 20mph limits | 61.7% of borough roads (up from 60.9%) | 19 boroughs at 95%+ | 100% coverage |
| Controlled parking | London coverage 42.3% (up from 42.1%) | Barking & Dagenham first Outer borough over 50% | Near-complete |
| Protected cycle track | Slight London-wide increase | Newham +6km (Romford Road, Silvertown Way, Beckton) | No reported addition |
| School Streets | 829 total; c.30% of schools | Lewisham 66%, Newham 51%, Islington 50% | Coverage fell |
| Bus priority | 11 boroughs updated | City of London highest overall; Hackney tops Inner London | Small addition |
| Sustainable modeshare | Borough average 68.1% (up from 67.9%) | City, Camden, Islington, Westminster lead Inner London | Among Inner London leaders |
| Active travel | 8 boroughs above 40% walking regularly | Richmond leads on walking | Walking and cycling fell |
| Road casualties | Est. 95 London fatalities in 2025 | Waltham Forest lowest cycling casualty rate | Rates worsened |
| Car ownership | 10% fewer cars than 2019; EVs/hybrids (17%) now outnumber diesels (15%) | Six boroughs over 70% car-free | Over 75% car-free, highest in Scorecard |
The report also records that London's total car fleet still stands at nearly 2.4 million, that the polluting-vehicle score improved in every borough, and that in Outer London, Bexley, Hillingdon and Havering again score lowest overall. "Compared to other major European cities, action on London's streets is slow, and many of the Mayor's targets for healthier, safer streets are behind schedule," the coalition spokesperson said.
New Councils Urged to Act — and TfL Receives Its First Score
Following London's recent borough elections, the coalition frames the coming term as decisive. "London's elections have changed the political shape of the city. It's going to be a critical four years for action, but we don't yet know how ambitious the many new administrations will be," a spokesperson said. "Most newly elected councils should be able to make significant progress on all the key measures in the next four years. TfL funding is available and there's a wealth of evidence as to the benefits they bring. It can take a long time to deliver change, so new councils really need to hit the ground running if they want to make a difference."
For the first time, the coalition has also scored Transport for London on the red routes it manages — formally the Transport for London Road Network. The findings were mixed. On the positive side, 267km of red routes now carry a 20mph limit, up from just 35km in 2019, and bus lanes increased over the year. But the report records no new protected cycle track, no reduction in traffic levels, an "alarming" number of junctions without a green man crossing, and a 2.4% rise in serious and fatal casualties. "This is the first year we have published scores for the roads that TfL manages and we really hope it will encourage the Mayor to dramatically increase the pace of improvement on London's arterial routes," the spokesperson said.
The full 2026 results, indicator data and borough commentaries, including for Westminster, are published on the Healthy Streets Scorecard website.
FAQ
Where did Westminster rank in the 2026 Healthy Streets Scorecard?
12th out of 33 boroughs, down five places from 7th in 2025, with a score of 5.69 out of 10.
What does Westminster still do well?
Full 20mph coverage, near-complete controlled parking, London's highest share of car-free households at over 75%, and a place among Inner London's four leaders on sustainable travel.
Why did Westminster fall in the rankings?
It has the lowest Low Traffic Neighbourhood coverage in Inner London, School Street coverage fell under stricter counting rules requiring enforcement, walking and cycling participation declined, and pedestrian and cyclist casualty rates worsened.
Who won the 2026 Scorecard?
Islington, Waltham Forest and the City of London, with Waltham Forest the year's biggest improver.
What changed in this year's methodology?
School Streets now only count if enforced by cameras or physical barriers, and TfL received its first-ever score for the red routes it manages.
Read about the life of Westminster and Pimlico district, London and the world. 24/7 news with fresh and useful updates on culture, business, technology and city life: Free London Bus Routes and DLR Lines 2026: How to Ride Across the Thames at Zero Cost Until May 26